Memory Analyzer is a tool developed in Eclipse that is used to find the cause for the Heap Dump generation in the SAP Java systems. There are several sources from SAP that I will list at the end of the article, but unfortunately this information if a little bit outdated, that is why I would like to clarify here what are the steps that need to be followed in order to install this tool and how can the dump can be analyzed with it.
These are the steps for the installation:
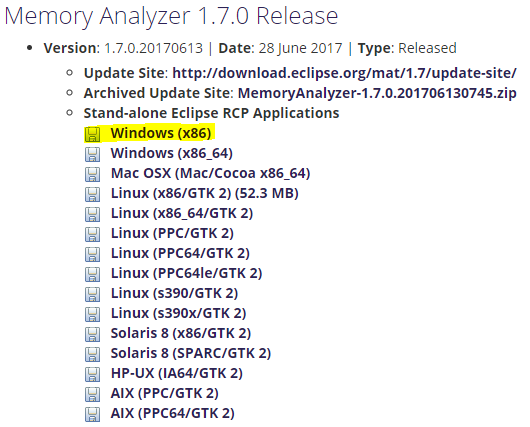
1. The download location is: http://www.eclipse.org/mat/downloads.php
If you have a windows environment you have to download the Windows (x86) kit to your local computer => MemoryAnalyzer-1.7.0.20170613-win32.win32.x86.zip

2. Download the extension pack from the note 1883568 – How to self analyze a Heap Dump using MAT
MemoryAnalyzer-extensions-update-site.zip
3. Unzip MemoryAnalyzer-1.7.0.20170613-win32.win32.x86.zip to your computer and run the MemoryAnalyzer.exe from the mat directory:
4. Install the extension downloaded earlier as follows:

Add the path to extension archive:


![]()


And the installation is completed, only a restart of the computer is necessary. That’s it, now the tool is ready to use.
Now, before opening the dump file you have to make sure that you have enough RAM memory available on the machine that you run the heap dump analysis, that is more than the size of the dump. It is possible that for larger dumps, you get this error when opening the file for analysis:

In order to solve this you have to change -Xmx parameter to a higher value from the tool file MemoryAnalyzer.ini located in the mat directory. The value has to be set to at least the size of the dump file:

Now just open the dump file:

The most used option is Leak Suspects Report, this analysis your dump, searches for the memory leak and lists what are the applications/libraries that are causing the problem, split in percentages.


Under each Problem Suspect you should find some keywords, that you can search for on SMP, SCN or if the suspect is a custom code or a third party application you can get in contact with the respective responsible to get to the root cause.
For more information about heap/thread dumps you can find in my post: SAP java heap and thread dumps
Useful related SAP notes and cocumenation:
2063943 – Memory Analyzer Tool stops the heap dump parsing due to insufficient memory
1883568 – How to self analyze a Heap Dump using MAT
https://wiki.scn.sap.com/wiki/pages/viewpage.action?pageId=237307510

