Definition of thread and heap dump
A thread dump is a snapshot of how the Java threads of the running server processes look at a point in time, whereas a heap dump is a snapshot of the memory of a java process.
Parameters
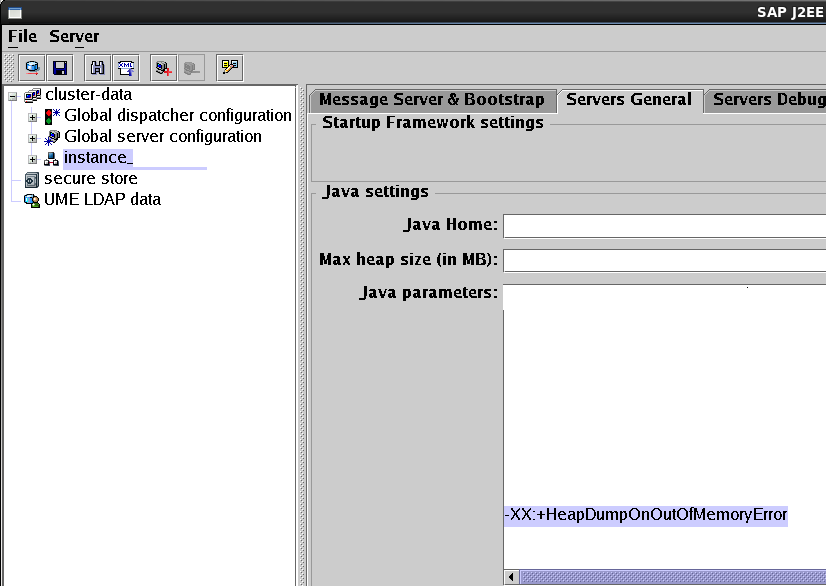
Automatically, by default, if there is an out of memory situation, the system itself will generate a heap dump. This behavior is assured by the java parameter XX:+HeapDumpOnOutOfMemoryError that you can find in configtool setup:

In case this parameter is deleted, the automatic generation of the dump will not happen. The file will have quite a big size, approximately the size of the java heap size.
Now, there is also a similar parameter -XX:+HeapDumpOnCtrlBreak that it is not set as a default, when this is activated a heap dump will be written together with the thread dump, every time a CTRL_BREAK (win) or SIGQUIT (unix) event is triggered manually or automatically by the system. So if such behavior is not intended, this parameter should be deleted, not to have unnecessary amount of heap dumps generated.
Naming conventions and paths
You can find the dumps in the default location: /usr/sap/SID/instance/j2ee/cluster/serverN. This location is also defined by a parameter in configtool -XX:HeapDumpPath=directory where to save the heap dumps and can be changed, in case for example, you do not have enough space in the default location and you want the dump to be generated somewhere else.
But this parameter path is valid only for dumps that are generated automatically by the parameter -XX:+HeapDumpOnOutOfMemoryError, not also by the parameter HeapDumpOnCtrlBreak.
Heap dumps generated automatically by OutOfmemory errors will have the naming: OOM.hprof and OOM.addons
Heap dumps generated by a user will look like java_pid.hprof and java_pid.addons.
On both situations, these can be found in /usr/sap/SID/instance/j2ee/cluster/serverN.
Standalone thread dumps will have the naming std_serverX.out and can be found in /usr/sap/SID/instance/work/
Generation methods
As of Java 7.3 it is very easy to manually generate a dump, if needed (for example in case of poor performance of the application). Both thread and heap dumps can be generated directly from NWA -> Troubleshooting -> Advanced Troubleshooting -> Thread Dump Analysis or Heap Dump Analysis

Another way to this, but a little bit more complex is from JSMON tool. You can list all the options available like this:
jsmon pf=instance_profile
help => to see all the options available
process sdump idx => to generate a thread dump of a process
or
process hsdump idx => to generate a heap dump of a process
A thread dump can be generated also outside of the system, from Solution Manger. This is how it looks like for Solman 7.1 SP14:
Go to SAP Solution Manager Work Center -> Root Cause Analysis -> System Analysis -> Choose the system for which you want to generated the thread dump -> Expert Links -> Start Embedded -> Thread Dump Analysis -> Trigger Thread Dump for the wanted processes:


Now that we talked about the heap dumps, you can find in my next post how to analyze this memory related dumps and how you can get an idea of what is causing the memory problems: SAP Memory Analyzer – MAT – installation and usage
Useful related SAP documentation:
1004255 – How to create a full HPROF heap dump of J2EE Engine 6.40/7.0
https://wiki.scn.sap.com/wiki/pages/viewpage.action?pageId=237307510
https://wiki.scn.sap.com/wiki/display/ASJAVA/%28JSTTSG%29%28Deploy%29Thread+Dump

